
Introduction: Track Your Website or Business KPIs
In today’s data-driven world, keeping tabs on your website or business performance is more important than ever. Key Performance Indicators (KPIs) are your go-to metrics for understanding how things are going and where you can improve. But tracking these metrics can feel like a daunting task if you don’t have the right tools.
Enter Google Sheets and Looker Studio. Google Sheets is a super versatile tool that makes it easy to enter, manipulate, and visualize your data. It plays nicely with a bunch of different data sources, making it perfect for tracking KPIs. Looker Studio (formerly Data Studio), on the other hand, is a powerful platform for creating detailed, interactive dashboards. When you combine these two tools, you get a flexible, user-friendly system for monitoring your KPIs.
In this article, we’ll walk you through how to use Google Sheets and Looker Studio to track your website or business KPIs. We’ll cover the benefits of each tool, give you step-by-step instructions on how to get started, and share some tips for making the most of your KPI tracking.
Preparing Your Data in Google Sheets
First, you need create a Google Sheets spreadsheet then prepare your data. The data needs to be in a table format, so that later Looker Studio can read it properly. For the following tutorial I’m going to use this data:
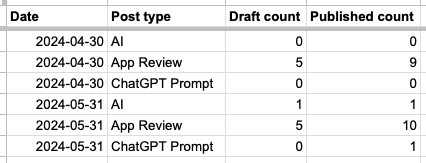
| Date | Post type | Draft count | Published count |
| 2024-04-30 | AI | 0 | 0 |
| 2024-04-30 | App Review | 5 | 9 |
| 2024-04-30 | ChatGPT Prompt | 0 | 0 |
| 2024-05-31 | AI | 1 | 1 |
| 2024-05-31 | App Review | 5 | 10 |
| 2024-05-31 | ChatGPT Prompt | 0 | 1 |
Visualizing Your Data using Looker Studio
Go to Looker Studio.
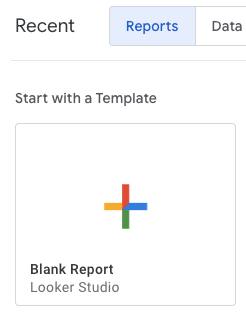
In Looker Studio > Reports, click Blank Report:
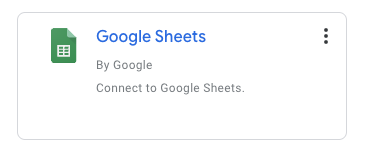
You will be prompted to add data (called a data source), choose Google Sheets:
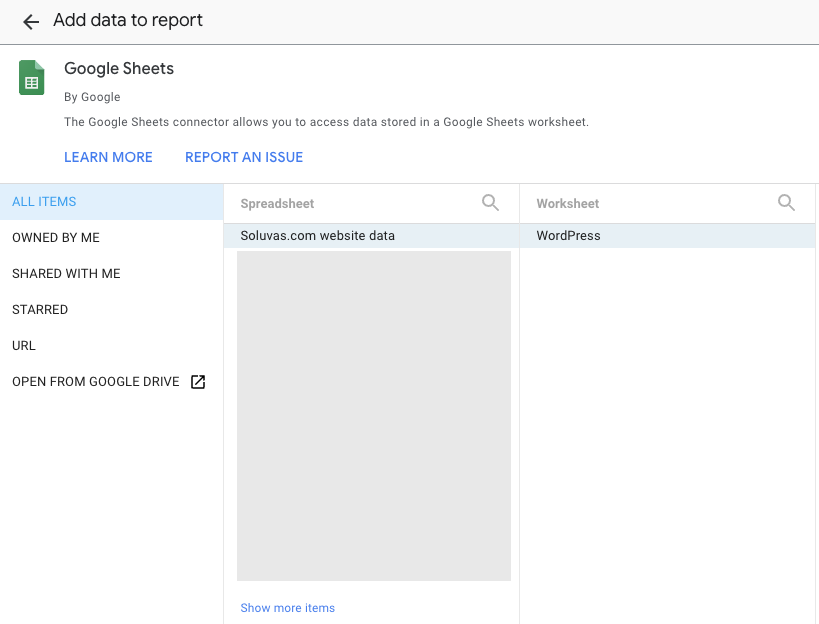
Choose your spreadsheet file, then worksheet. In Options, make sure “Use first row as headers” and “Include hidden and filtered cells” are both checked. Click Add button.
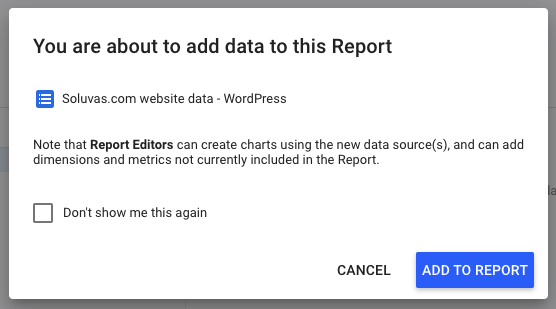
Click Add to Report button.
You will be shown a “table chart” containing values from your worksheet. Delete that table and let’s create a new chart to represent our data.
Creating a Stacked Bar Chart
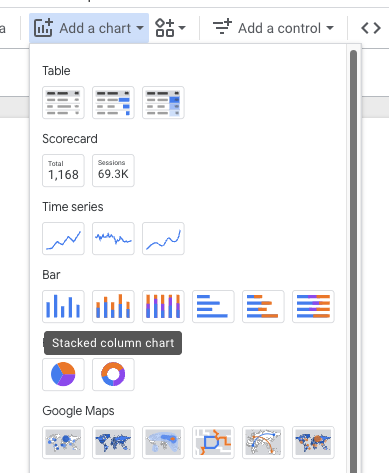
From the toolbar, click Add a chart > Bar > Stacked column chart.
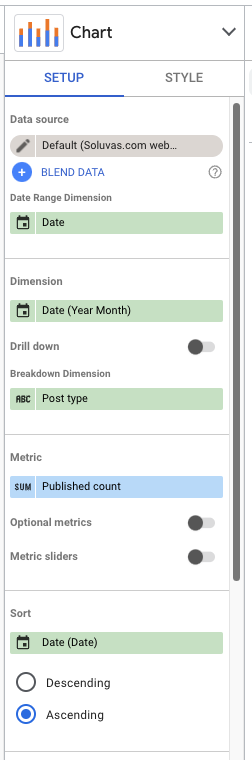
- Set the Dimension to “Date”
- Then click on the little date icon, it will change to an edit icon. Change the data type to Date & Time > Year Month.
- Set the Breakdown Dimension to “Post type”
- For Metric, set to “Published count”
- For Sort, set to Date. Then click on Ascending.
The final Stacked Column Chart setup would look like this:
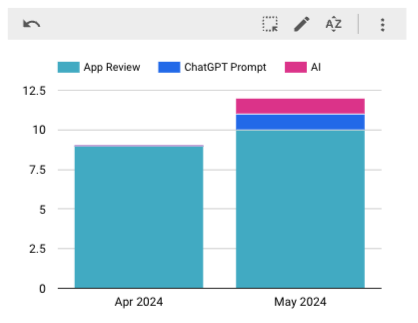
And the actual chart looks like this:
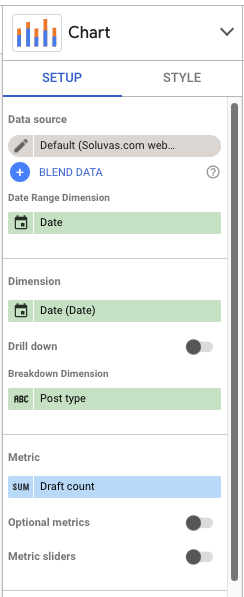
Create Another Stacked Column Chart to Display the Draft Count
You can copy & paste the first chart, then edit the second chart’s setup as follows:
- Metric: Draft count
To make the report more understandable, from the toolbar, insert a text box and provide titles above each chart.
The final resulting report now looks like this:
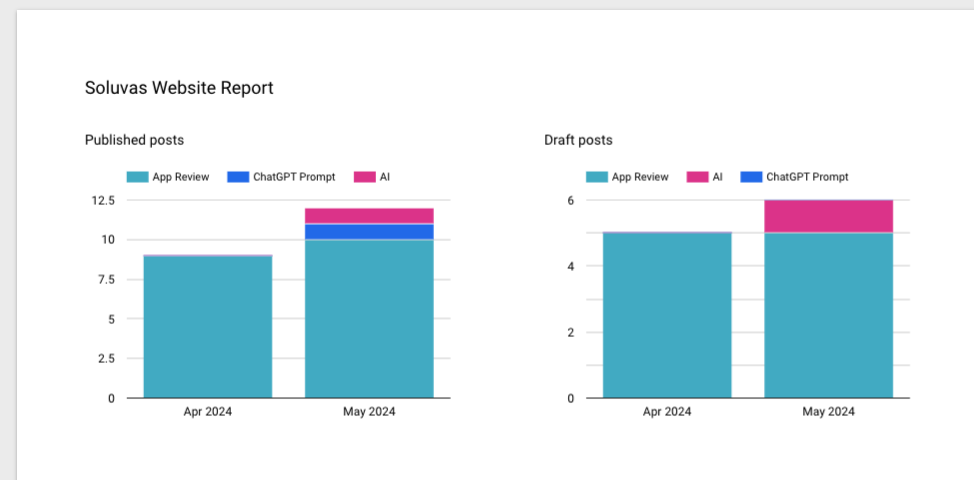
Congratulations! You have created a report using Google Sheets and Looker Studio.
Conclusion
Keeping track of your website or business KPIs doesn’t have to be complicated. With Google Sheets and Looker Studio, you’ve got a powerful combo that makes it easier to stay on top of your performance. Google Sheets is perfect for collecting and playing with your data, while Looker Studio helps you create awesome, interactive dashboards that make your data easy to understand.
Sure, setting everything up might take a little time, but it’s totally worth it. Once you’ve got everything in place, you’ll have a flexible and scalable system for keeping an eye on your most important metrics. Start by figuring out which KPIs matter most to your business, set up your data collection in Google Sheets, and then build your dashboards in Looker Studio. By regularly tracking and analyzing your KPIs, you’ll be able to make smarter decisions and keep your business moving in the right direction.